Crowd-Solving 101: The Process in 8 Pictures
- harry2180
- Mar 11, 2022
- 7 min read
Updated: Jun 28, 2023
Before my first crowd-solving project started in 2020, I spent a lot of time looking for information on how a “normal” open-innovation project should proceed and what all of our participants should expect as the project advanced. Unfortunately, I did not find any first-person accounts. The target audience for this blog is people that are in a similar situation to mine of a couple of years ago.
I have had the opportunity to be Project Advisor on eight open-innovation projects over the past 17 months. Four were for Habitat for Humanity International (“HFH”) and four were for World Vision (“WV”)[See NOTE 1]. I have written about the great success of most of the challenges and about the InnoCentive crowd-solving process in prior blogs. Now I want to consolidate my learnings into one place.
This information is useful for humanitarian crowd-solving and should be applicable to non-humanitarian challenges as well, except for the ‘elapsed-time’ analysis. I have organized the charts to reflect the flow of a typical InnoCentive project.
This blog has the following sections:
Attracting Solvers
Attracting Submissions
Judging
Time Commitments (Elapsed and Staff)
Conclusions
1. Attracting Solvers
Crowd-solving is a numbers game: the more properly-skilled people that know about the challenge, the more likely someone will be to submit a proposal that becomes a winner. So, the first indications one will get about how the challenge is proceeding is at the bottom of the challenge home page where InnoCentive posts information about the daily number of solver registrations and the daily number of submissions (see Figure 1).

Figure 1.
The difficulty with this presentation is that one cannot easily compare the progress on a specific challenge to what has happened on other ‘normal’ challenges. This led me to create a normalized-growth chart (see Figure 2) to track the cumulative progress of each challenge in attracting registered solvers. The chart allows easy comparison of one challenge to another.

Figure 2.
The challenges are ordered by their launch dates with IDs of 1 to 8. The obvious outlier is the yellow line for the World Vision ideation challenge looking for new ideas for low-cost rural sanitation. This challenge experienced a small ‘viral’ effect after day 34. This chart can serve as a useful point of reference for future challenges that you are responsible for.
One of the major decisions for the Seeker during the early part of the open period for a challenge is the publicity strategy for the challenge. InnoCentive does a good job of publicizing their challenges to their existing solver community (of 500,000 people) so there is little need for additional publicity to attract their attention. But, depending on the type of problem being solved, it may be prudent to try to supplement this crowd with additional people that might have useful skills.
If you run supplemental marketing meant to attract new solvers to the InnoCentive platform so they register for your challenge, you will need to work with your InnoCentive project manager to track the results of your efforts.
I was not able to track the marketing source of Solvers as they registered for each challenge. This would have been the best and most immediate way to measure the effectiveness of our supplemental marketing. Instead, after each challenge closed its open solicitation, InnoCentive was able to provide me with information on the registration date of each registered solver. Assuming that anyone who registered after the challenge launch date registered on InnoCentive in order to get challenge details on our challenge, one can get an indication of the impact of different marketing initiatives.
In Figure 3, you can see the portion of registered solvers on each challenge that were NOT part of the InnoCentive crowd on the first day of each challenge. The blue columns are from the first wave of challenges where we did our most intensive marketing including multiple press releases and some limited paid advertising. The orange columns are from the second wave of challenges where we reduced our marketing efforts. There does appear to be a correlation between marketing effort and registrants new to InnoCentive.

Figure 3
My conclusion is that all of the challenges had a substantial number of registered solvers that were new to InnoCentive. Conversely, all of the challenges generated a substantial amount of interest from the InnoCentive crowd. The InnoCentive crowd is valuable asset for crowd-solving which can be effectively supplemented by intelligent marketing efforts.
2. Attracting Submissions
Of course, registered solvers is NOT the key metric for a challenge. The desired end result is submissions. In all eight challenges, we found that the daily number of submissions was close to zero until the last few days of the challenge’s open solicitation period. This was nerve-racking for us because every day it appeared that each challenge might fail to attract enough submissions to generate a winning answer.
Our worry before the deadline about submission volume was generally unnecessary. The last three days of the submission period are by far the most important days of any challenge (see Figure 4).

Figure 4.
In all eight cases, the last 3 days brought in a LOT of submissions, with the last day bringing in the most. On average, the last day brought in 28% of all the submissions with 37% being the highest result. The last 3 days brought in an average of 40% of all the submissions for a challenge.
YIELDS
As the challenge solicitation period proceeded, I also worried about how good the submissions we received would be. That is, it would be useless if we received a lot of submissions but they were all of poor quality. This led me to invent a new concept that I call the ‘yields’ for a challenge. There were two yields of interest: a) What percentage of registered solvers would submit a proposal (“submission yield”); and, b)How many of these would be complete and professional (“quality yield”)?
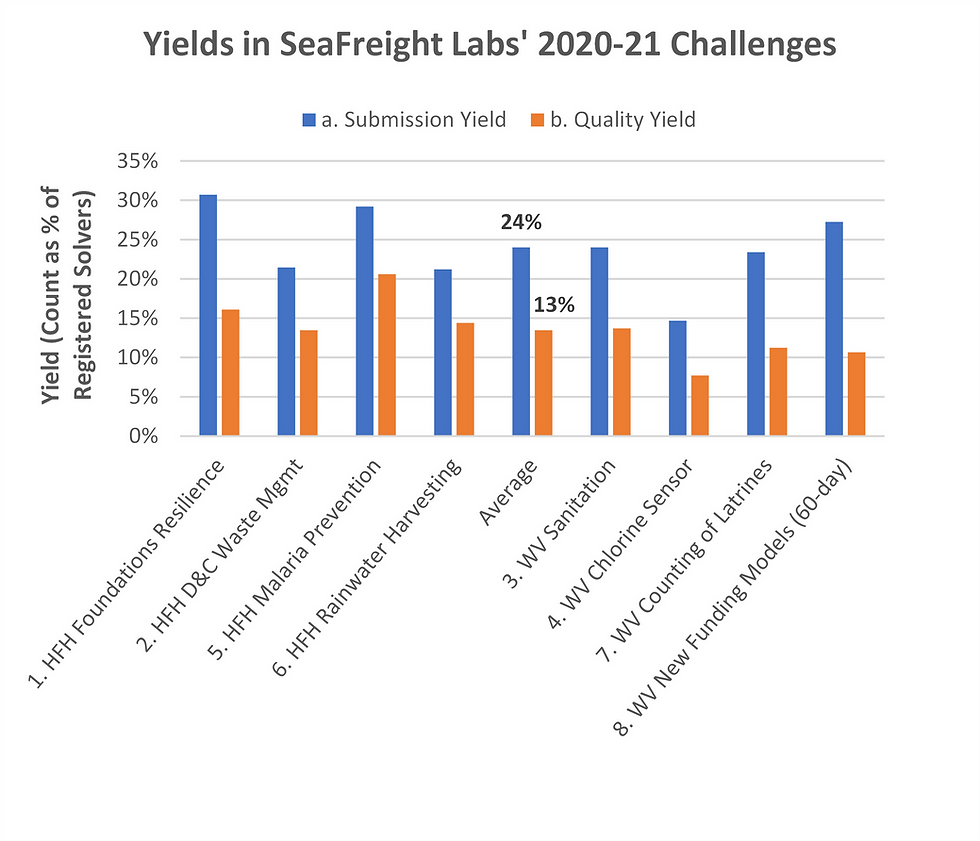
Figure 5.
This figure is organized with the Habitat for Humanity challenges on the left and the World Vision challenges on the right. For some reason, the World Vision challenges had generally lower yields than the Habitat challenges.
3. Judging
The judging process is when we finally were able to see if all of our prior work would have any benefits. I am happy to report that the paid off! Of the six completed challenges (as of this writing), five awarded prize money. This means that the Seekers felt that there were submissions good enough to make an award in these five.
Given this success, my follow-on question was to understand where the solvers came from. Were they from the InnoCentive crowd or new crowd-solvers? Figure 6 answers this question for the five completed challenges with winners.

Figure 6.
Once again, we see that the InnoCentive crowd is uniquely valuable for generating interest and high-quality submissions. We also see that, for humanitarian challenges, it is useful to supplement the InnoCentive crowd with supplemental marketing because the global crowd will also have valuable input to the challenge.
4. Time Commitments (Elapsed and Staff)
I wrote about the elapsed time for a humanitarian challenge is a prior blog in October 2021 (see HERE). Since the publication of that blog, time has passed and more of the challenges have been completed. Figure 7 shows the updated phase duration chart.

Figure 7.
I wrote about the staff time required to organize and complete a humanitarian challenge in December 2021 (see HERE). I have not updated the calculations since publishing that article, but include the key figure here for easy reference. See Figure 8. Note that the "Organization" in the chart below is the Seeker's organization.

Figure 8.
5. Conclusions
The process of running a humanitarian challenge is a major commitment for every Seeker organization that decides to tap into the global crowd for help on solving important problems. When the organization has never done it before, there is likely to be a lot of uncertainty, leading to unnecessary anxiety. Everyone will be constantly asking, “Is it working?”
I can confidently tell you that humanitarian crowd-solving DOES work (see HERE for more details). Following the long-proven InnoCentive process will help you navigate all of the important steps to success. I hope this blog will help you feel confident that you are on the right path as the project proceeds forward.
Good luck!
---------------------------------------------------------------------------------------------------------------------------
[Note 1]
Habitat for Humanity’s were (in order of launch):
(#1 above) “Increasing Resilience to Earthquakes and Typhoons for Homes with No Foundations” which launched as an RTP (“Reduction-To-Practice”) challenge on 7 October 2020 and closed on 5 January 2021. The challenge prize was US$25,000 with the winner announced on 28 September 2021.
(#2 above) “Improved Construction and Demolition Waste Management” which launched as an ideation challenge on 26 October 2020 and closed on 25 January 2021. The challenge prize was US$15,000 and was awarded on 22 July 2021.
(#5 above) “Malaria Prevention through Innovations in Home Design or Home Life” which launched as an RTP challenge on 9 March 2021 and closed on 7 June 2021. The challenge prize was US$20,000. Judging continues as of the writing of this blog.
(#6 above) “Affordable Water Harvesting for Low-Income Households in Urban Areas” which launched as an RTP challenge on 2 April 2021 and closed on 5 July 2021. The challenge prize was US$25,000 with the winner announced on 20 January 2022.
World Vision’s were (in order of launch):
(#3 above) “Affordable Rural Single Family Sanitation Solutions” which launched as an ideation challenge on 14 October 2020 and closed on 12 January 2021. The challenge prize was US$15,000 with the winners announced on 29 June 2021.
(#4 above) “Low-Cost Chlorine Monitoring for Rural Piped Water Systems” which launched as an RTP challenge on 4 November 2020 and closed on 4 February 2021. The challenge prize was US$20,000 with the winner announced on 29 January 2022.
(#7 above) “Efficient and Reliable Counting of Improved Latrines” which launched as an RTP challenge on 9 June 2021 and closed on 7 September 2021. The challenge prize was US$20,000. The challenge had no winners and was withdrawn.
(#8 above) “Leveraging Funds to Increase Investment in Water, Sanitation and Hygiene” was launched as a theoretical challenge on 13 July 2021 and closed on 14 September 2021. This was the only 60-day challenge in our set of 8 challenges. The challenge prizes were US$20,000 for a first prize, US$10,000 for a 2nd prize and US$5,000 for a 3rd prize. Judging continues as of the writing of this blog.
See www.seafreightlabs.com/our-challenges for more details.


Comments